Indicator for TradingView
CryptoGPT Navigator — a ready trade plan on your chart
The indicator finds trades on 1H, 4H and 8H, draws the entry, stop and three targets, and manages the trade until it closes. For people who trade themselves: at the chart or from phone alerts.
- You trade yourself on Bybit or another exchange
- You want a plan with risk set before entry
- No time to watch charts
Trial — 7 daysPlans from 32 USDT per monthThe bot replies in Russian for now
The indicator is an analysis tool, not investment advice.
- Signal on candle close
- Plan: entry, stop, 3 targets
- TP1 → stop to break-even
- TP2 → stop to TP1
- TP3 — target
Example notifications, prices are illustrative.
What you get
Signal, plan and trade management
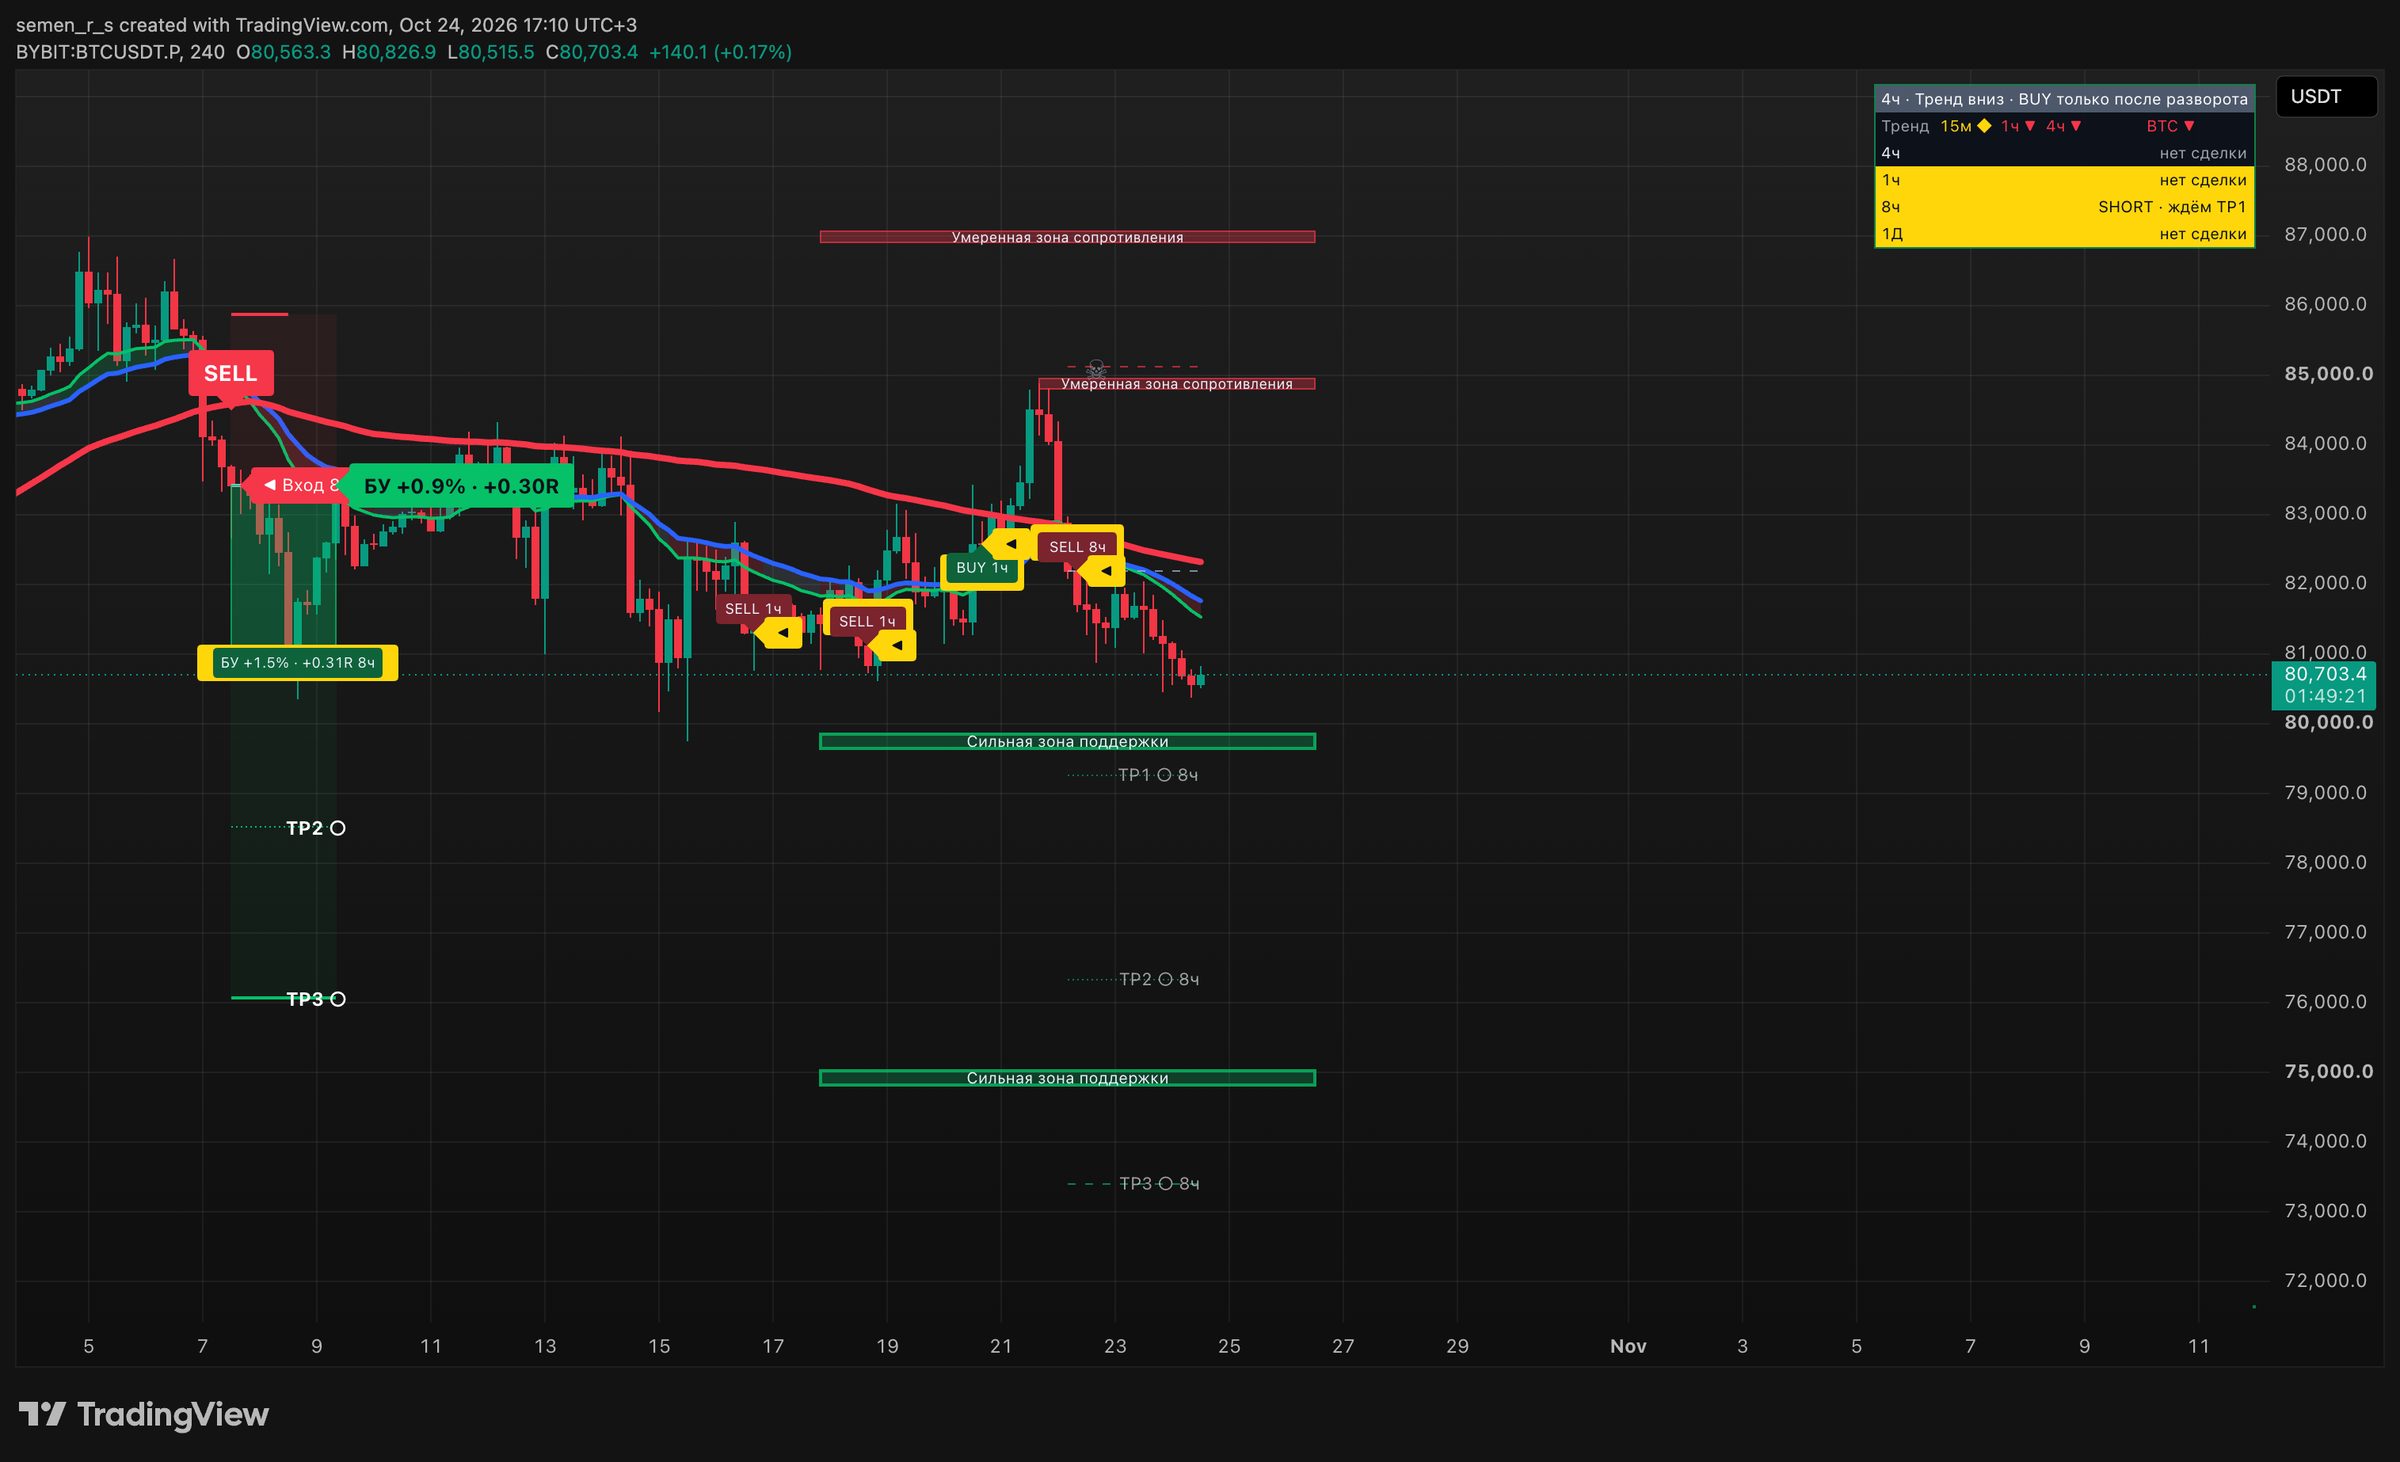
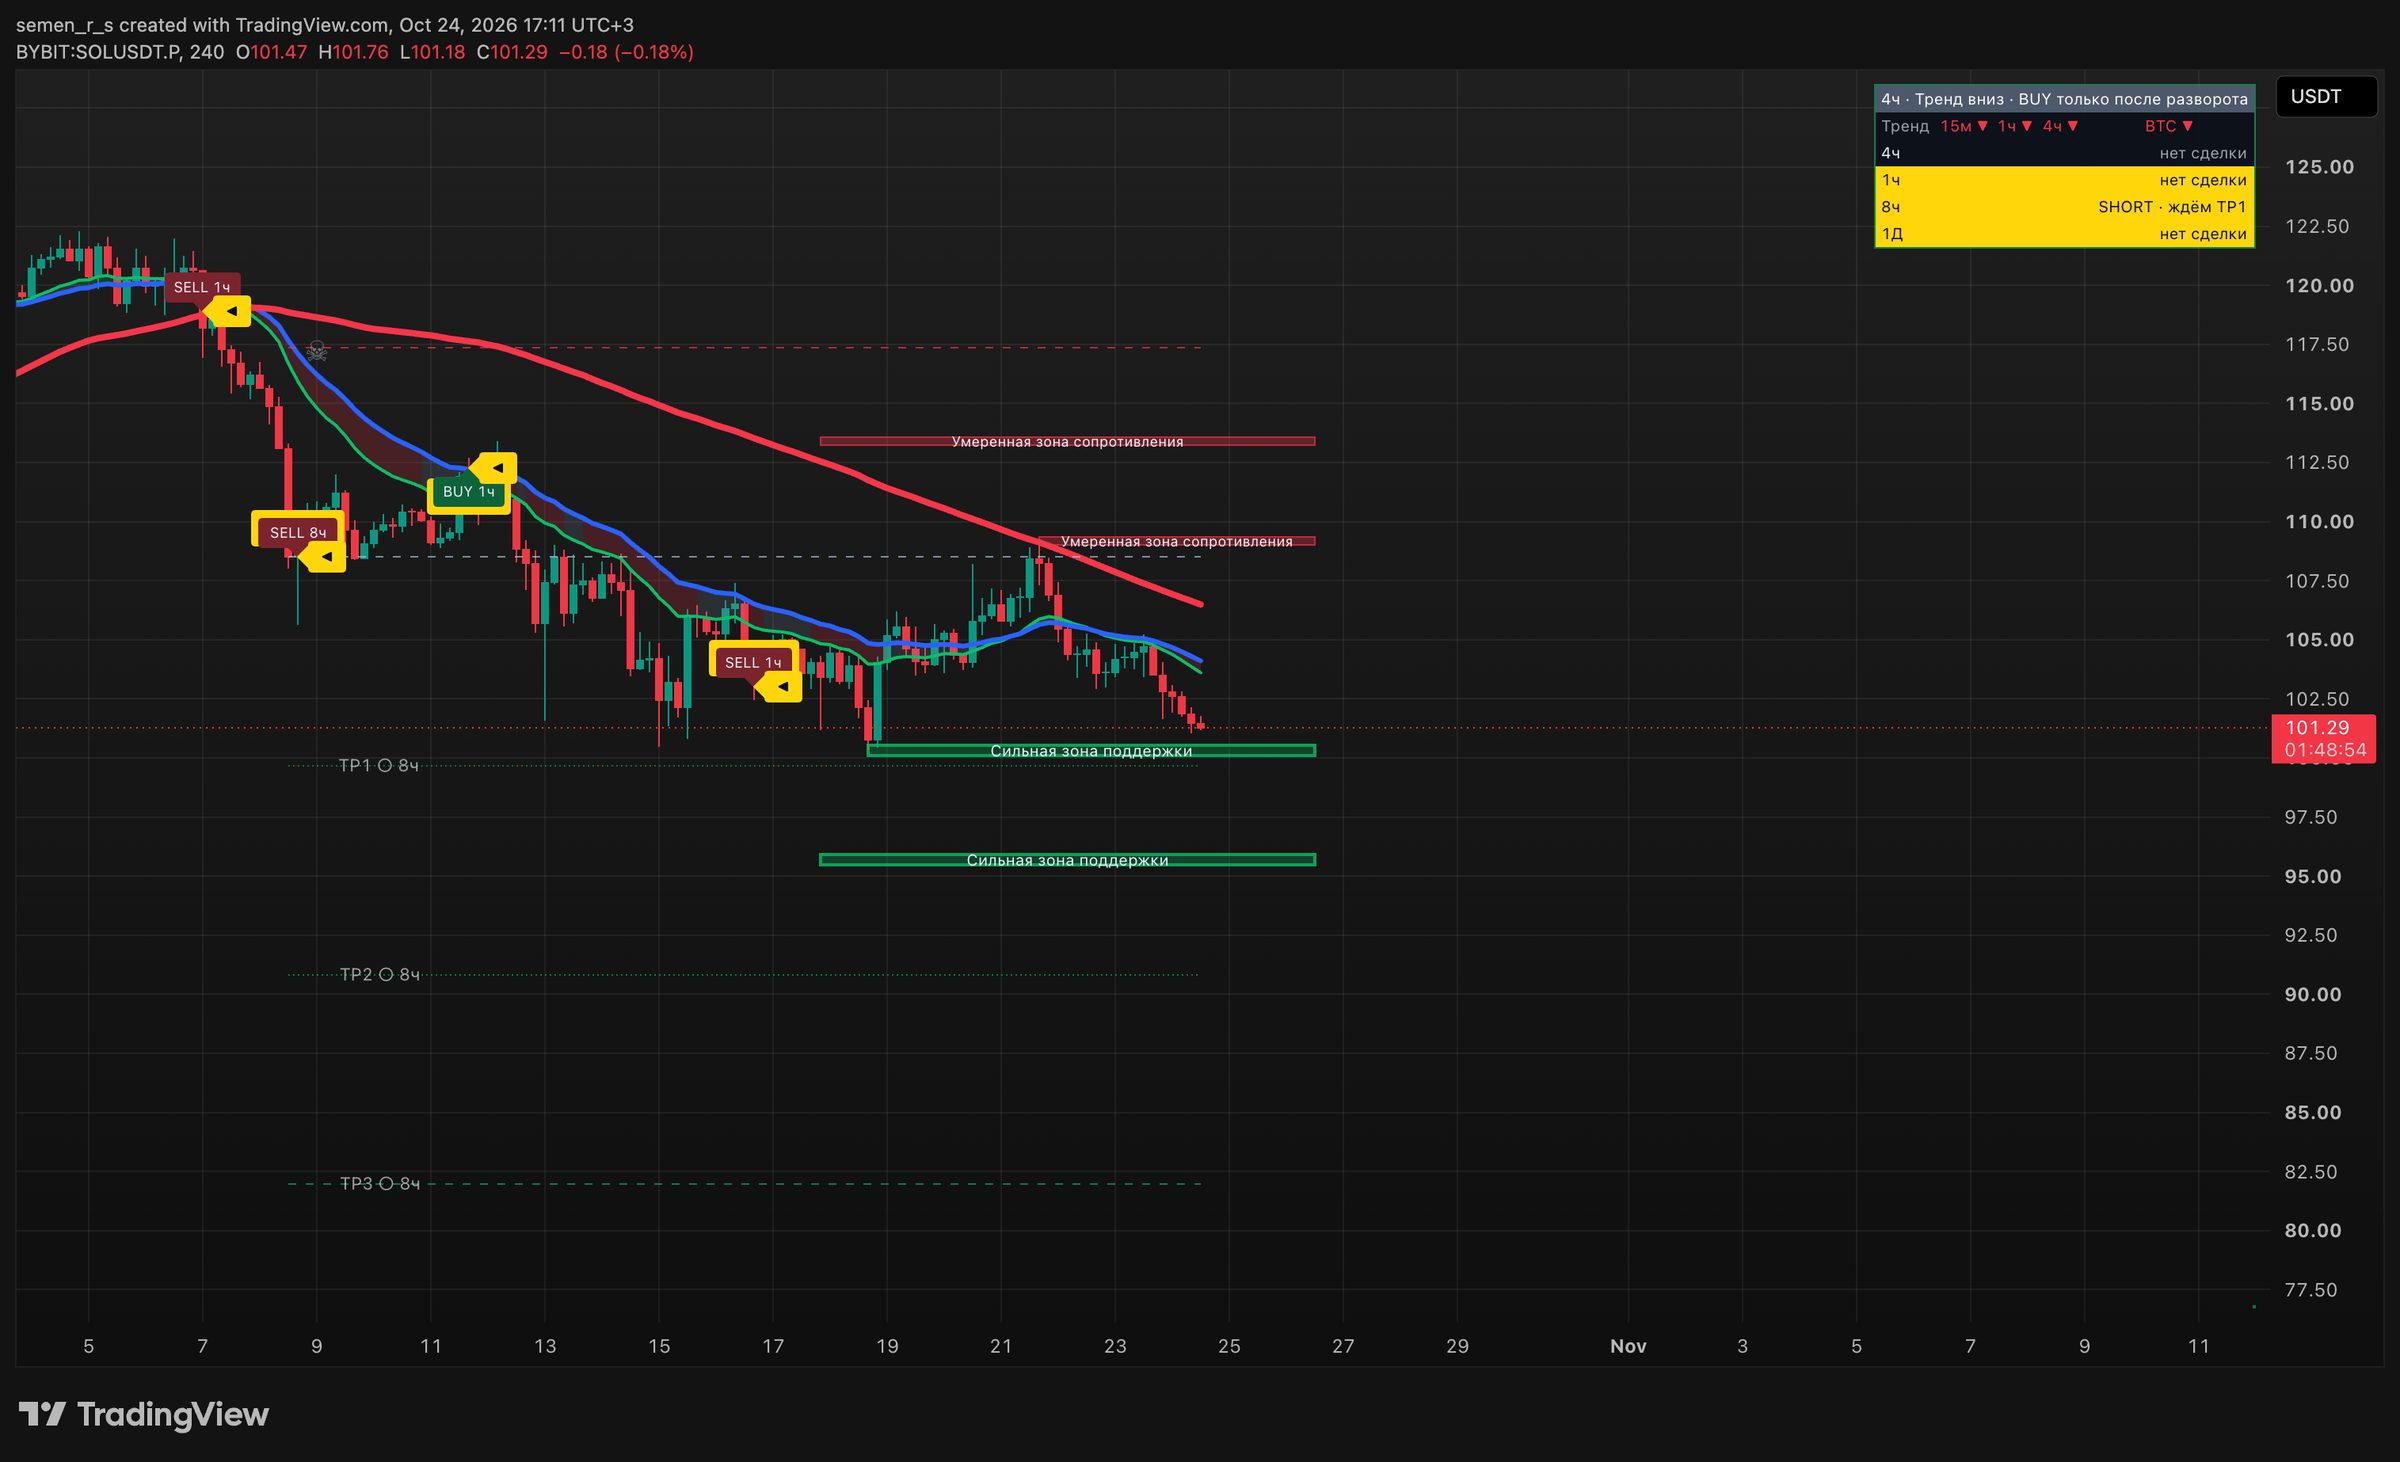
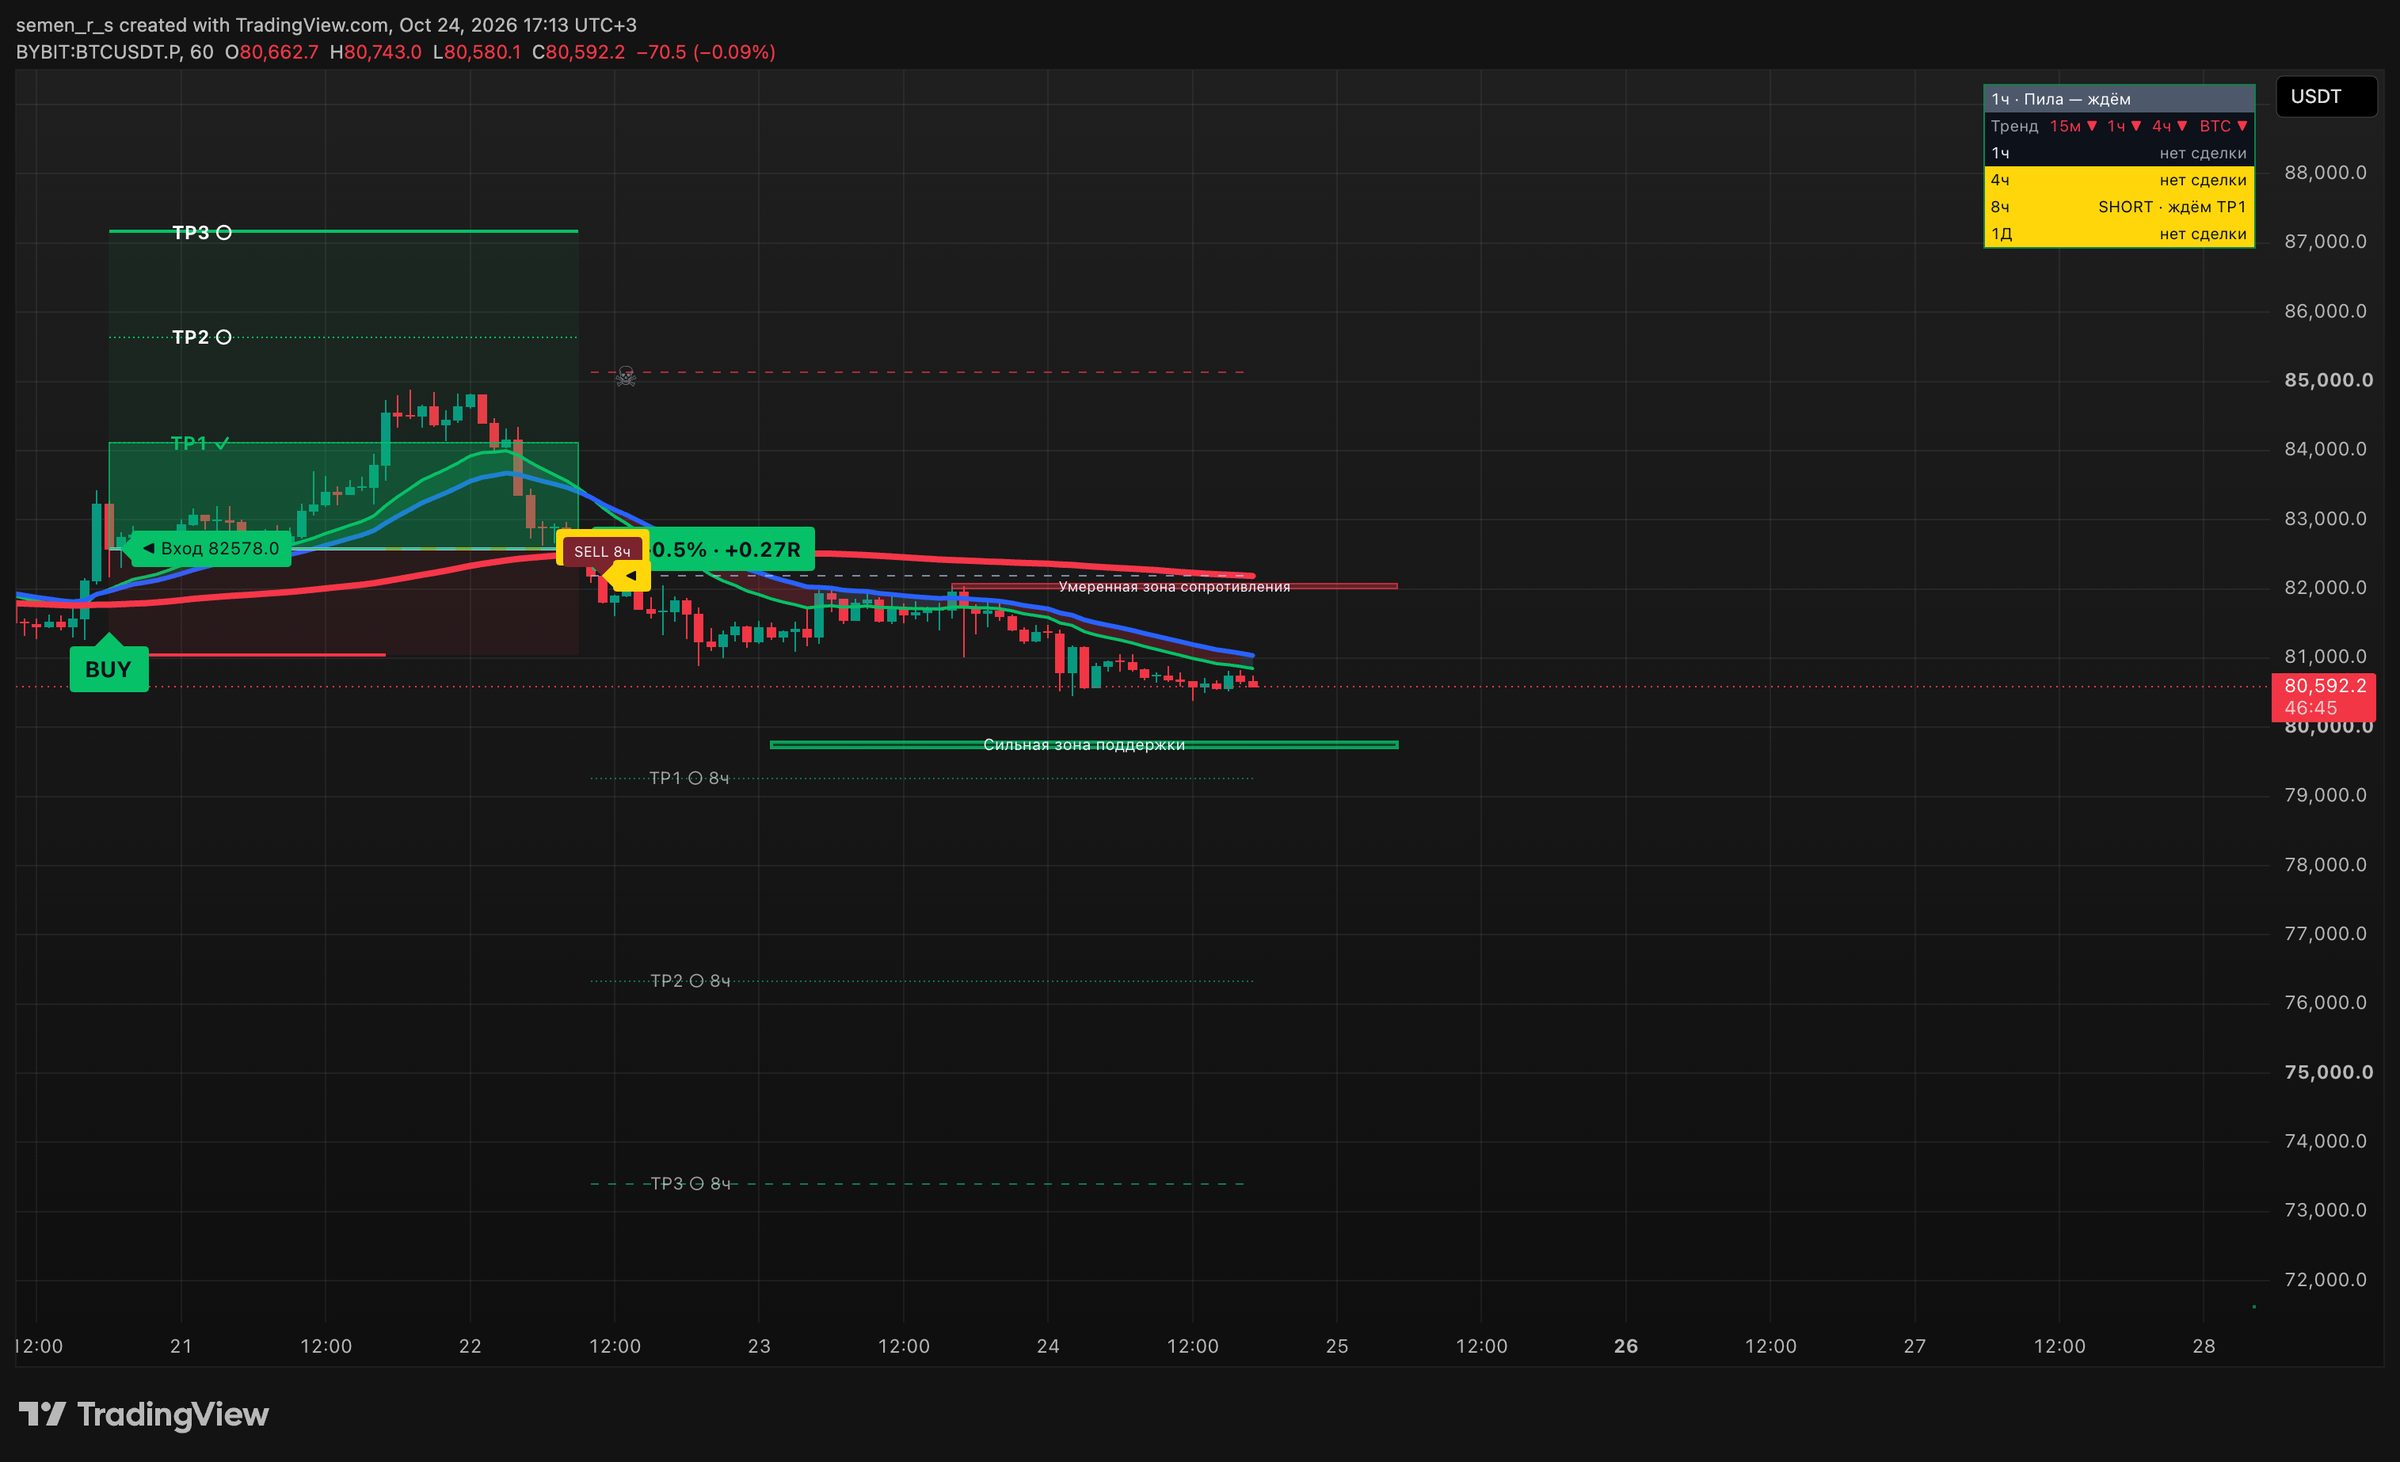
- SignalEntry, stop and 3 targetsBUY or SELL on candle close, no repainting. The plan appears on the chart at once.
- ManagementClear next stepsAfter TP1 the stop moves to break-even, after TP2 to TP1. The trade guidance panel shows the next step.
- AlertsNo need to watch the chartEntry with position size, stop changes and closing — notifications arrive on your phone.
- FiltersStays out of bad conditionsSkips choppy markets and trades against the trend or BTC. 1H, 4H and 8H on one chart.
How it looks
On a TradingView chart
How-to
How to use it: 4 steps
🧰 All in one indicator. Besides signals, Navigator has built-in EMA and SMA moving averages, Bollinger Bands, RSI, MACD, Ichimoku, VWAP and daily/weekly levels. The free TradingView plan limits how many indicators you can add to a chart — here it all counts as one indicator, so you don't need to add each tool separately.
- ⚙️ Open the settings Hover over CG Navigator on the chart and click the gear (or double-click) → Inputs tab. The labels are in Russian — the screenshot shows where each option is.
- 📈 EMA moving averages In the extra tools block, tick moving averages 1, 2 and 3 — 20, 50 and 200 by default. You can change the length and switch between EMA and SMA.
- 🎯 Bollinger Bands One checkbox in the same block. Default 20 candles and 2σ — shows when price is at the edge of its range.
- 📊 Lower panel: MACD or RSI Lower panel block → the “what to show” list: MACD, RSI, the market state line or the result curve.
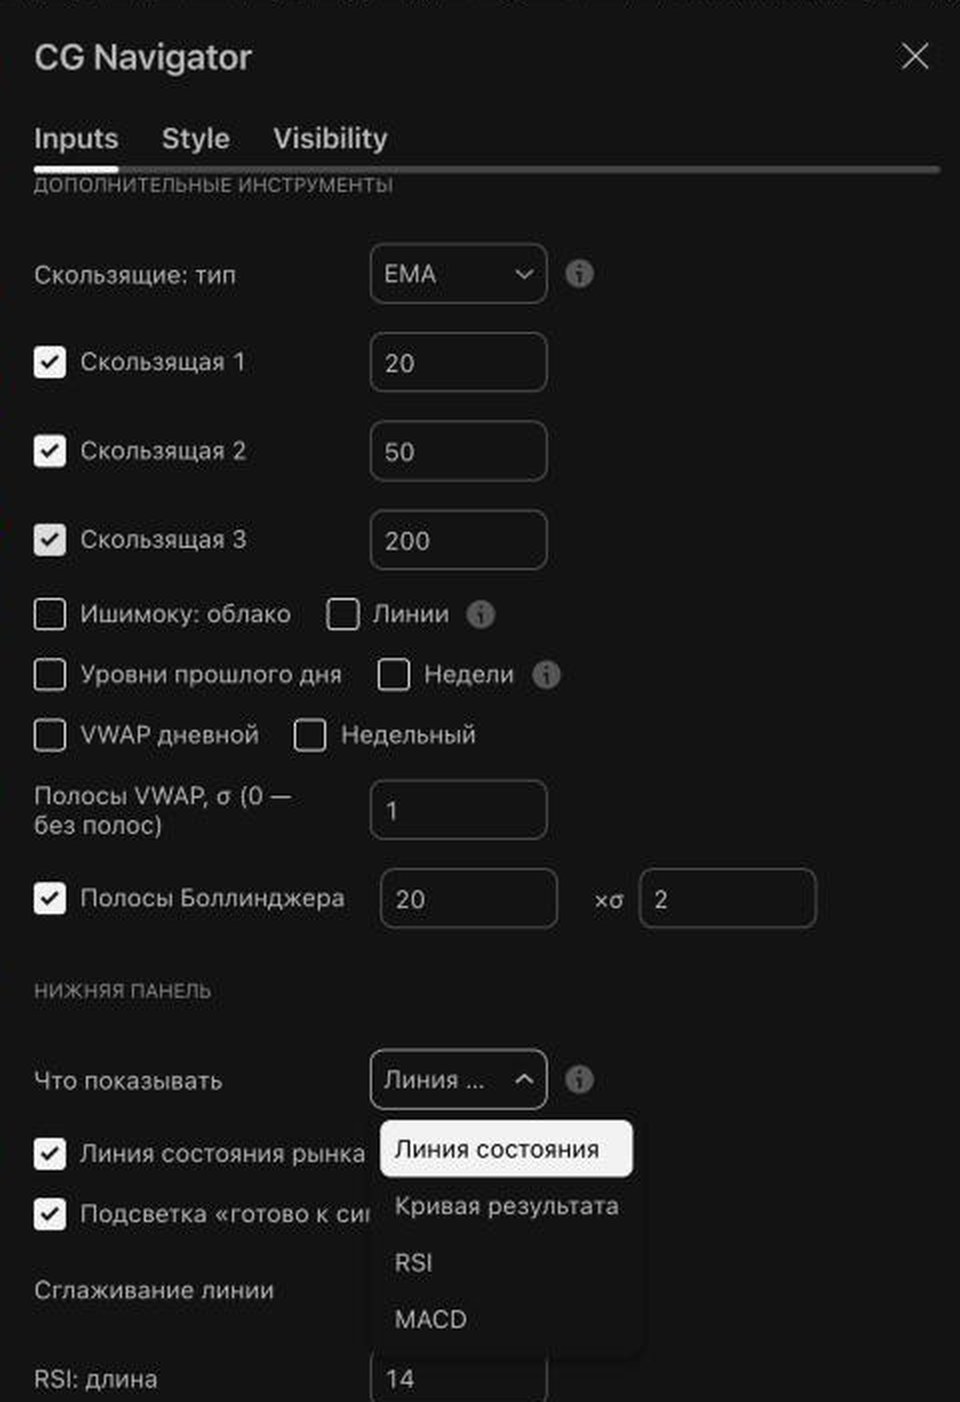
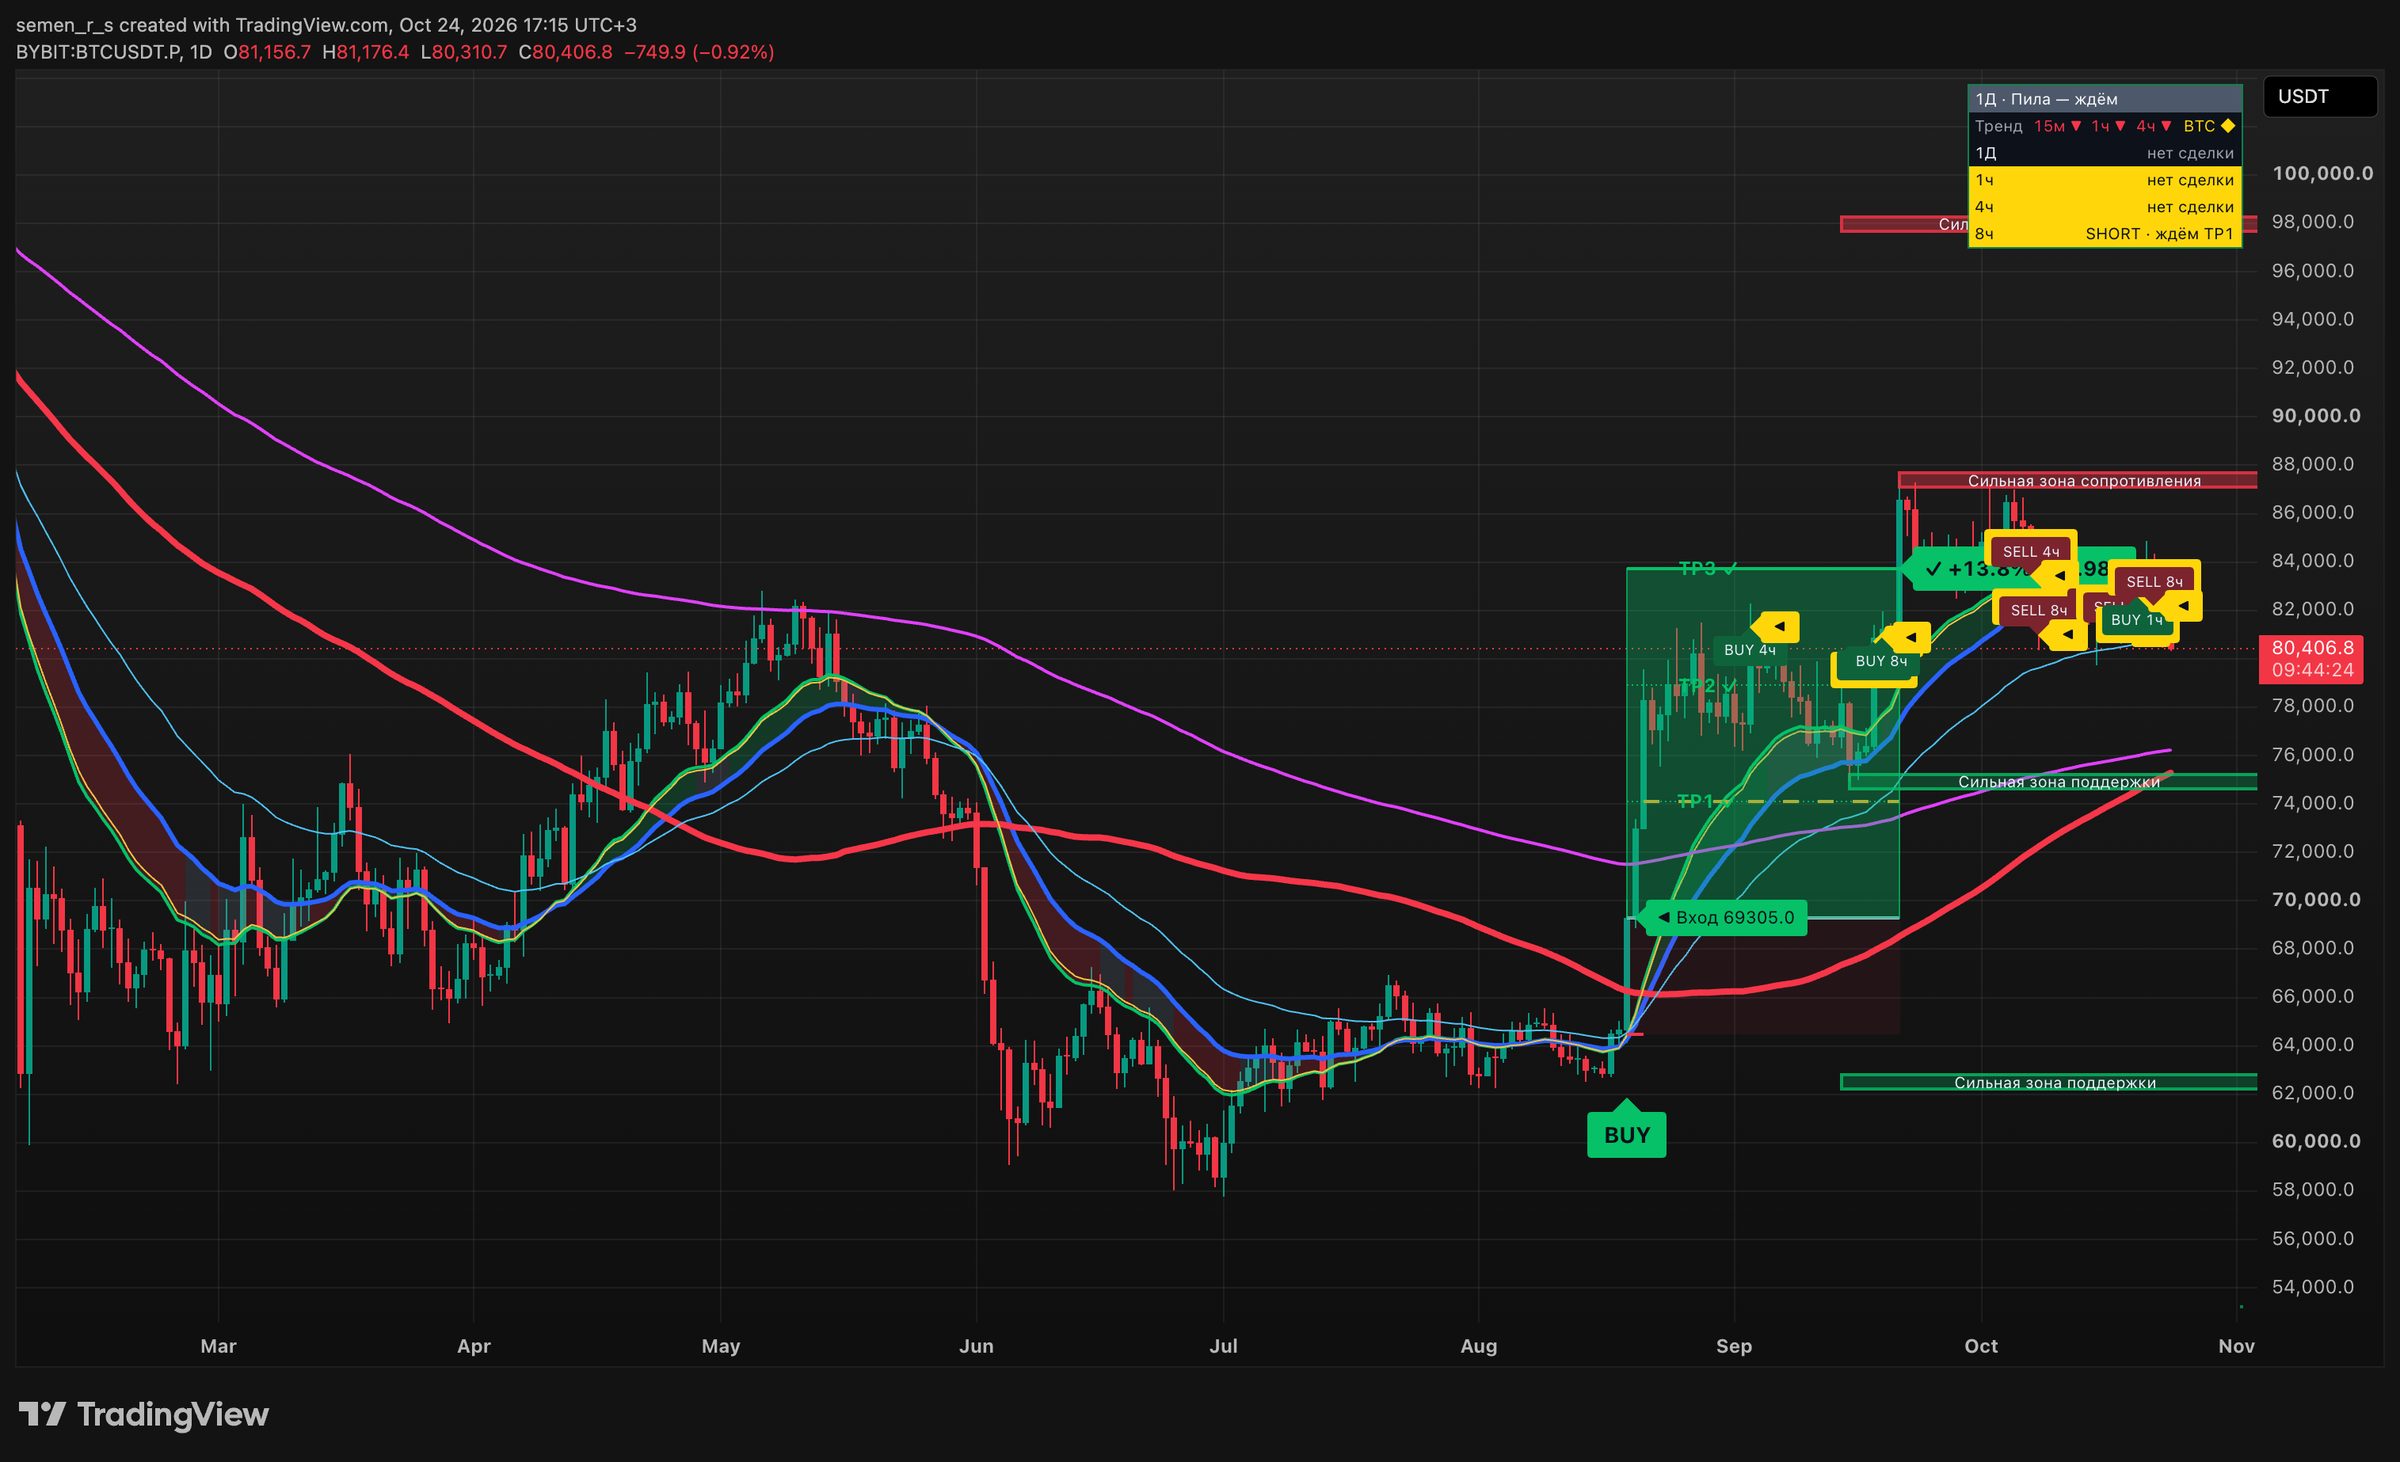
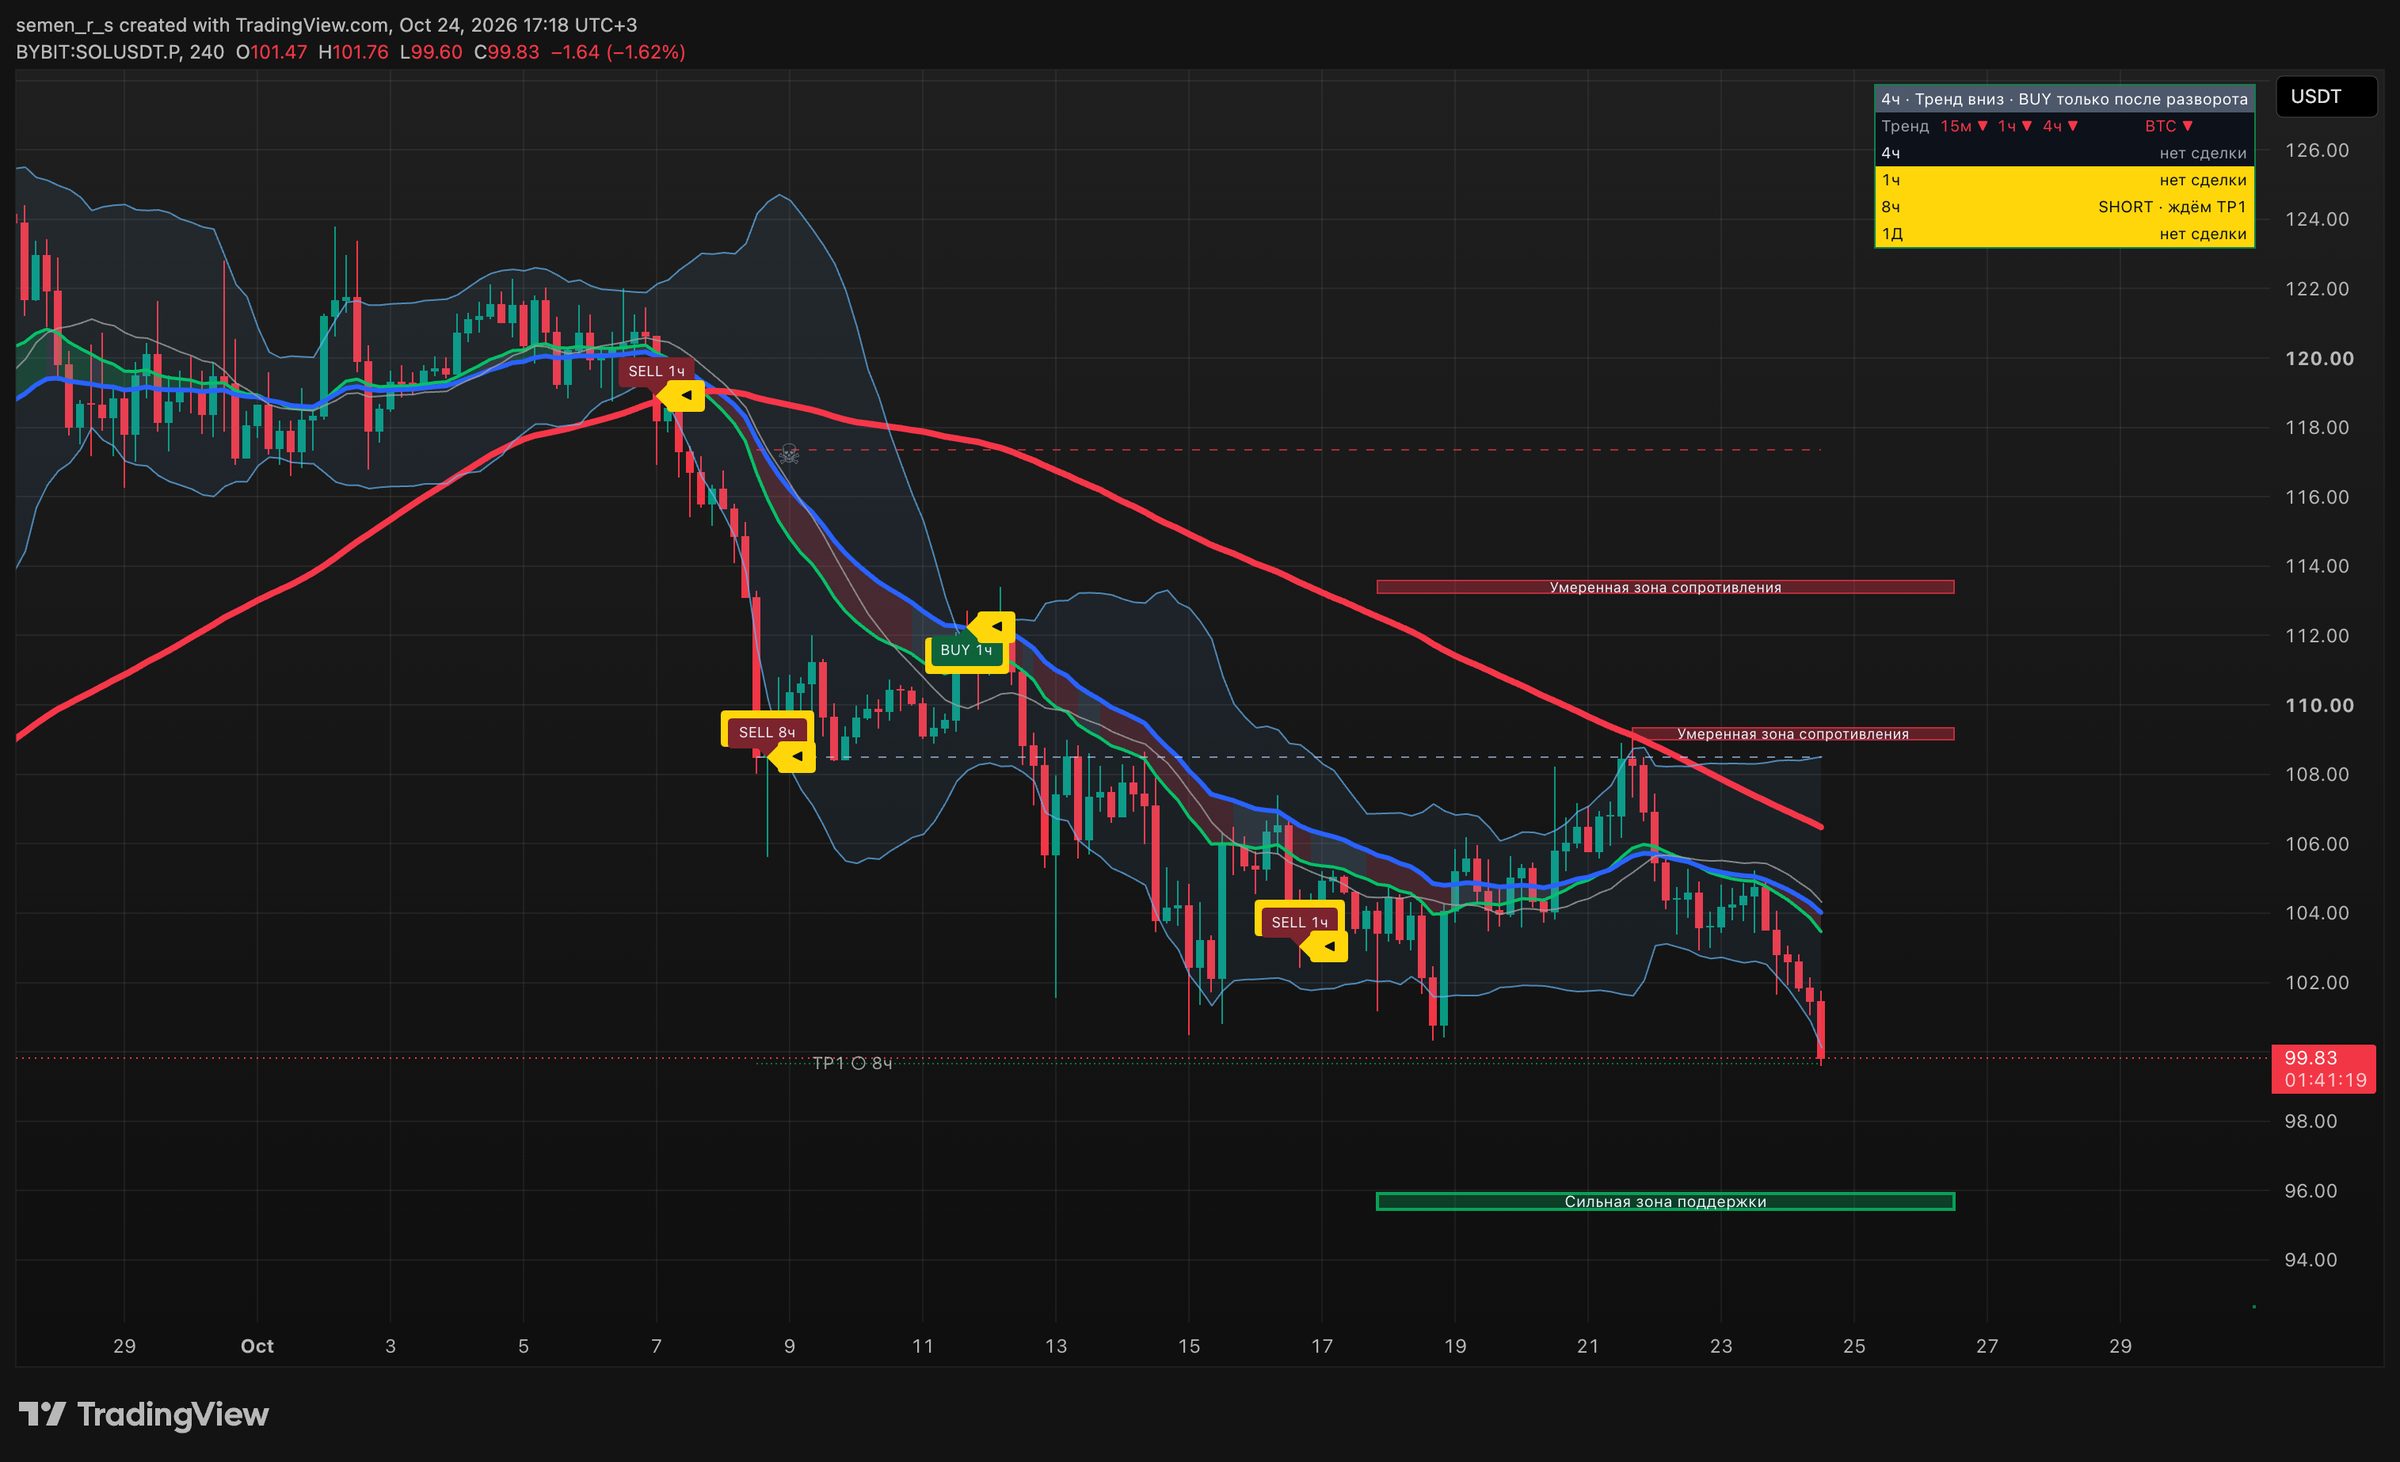
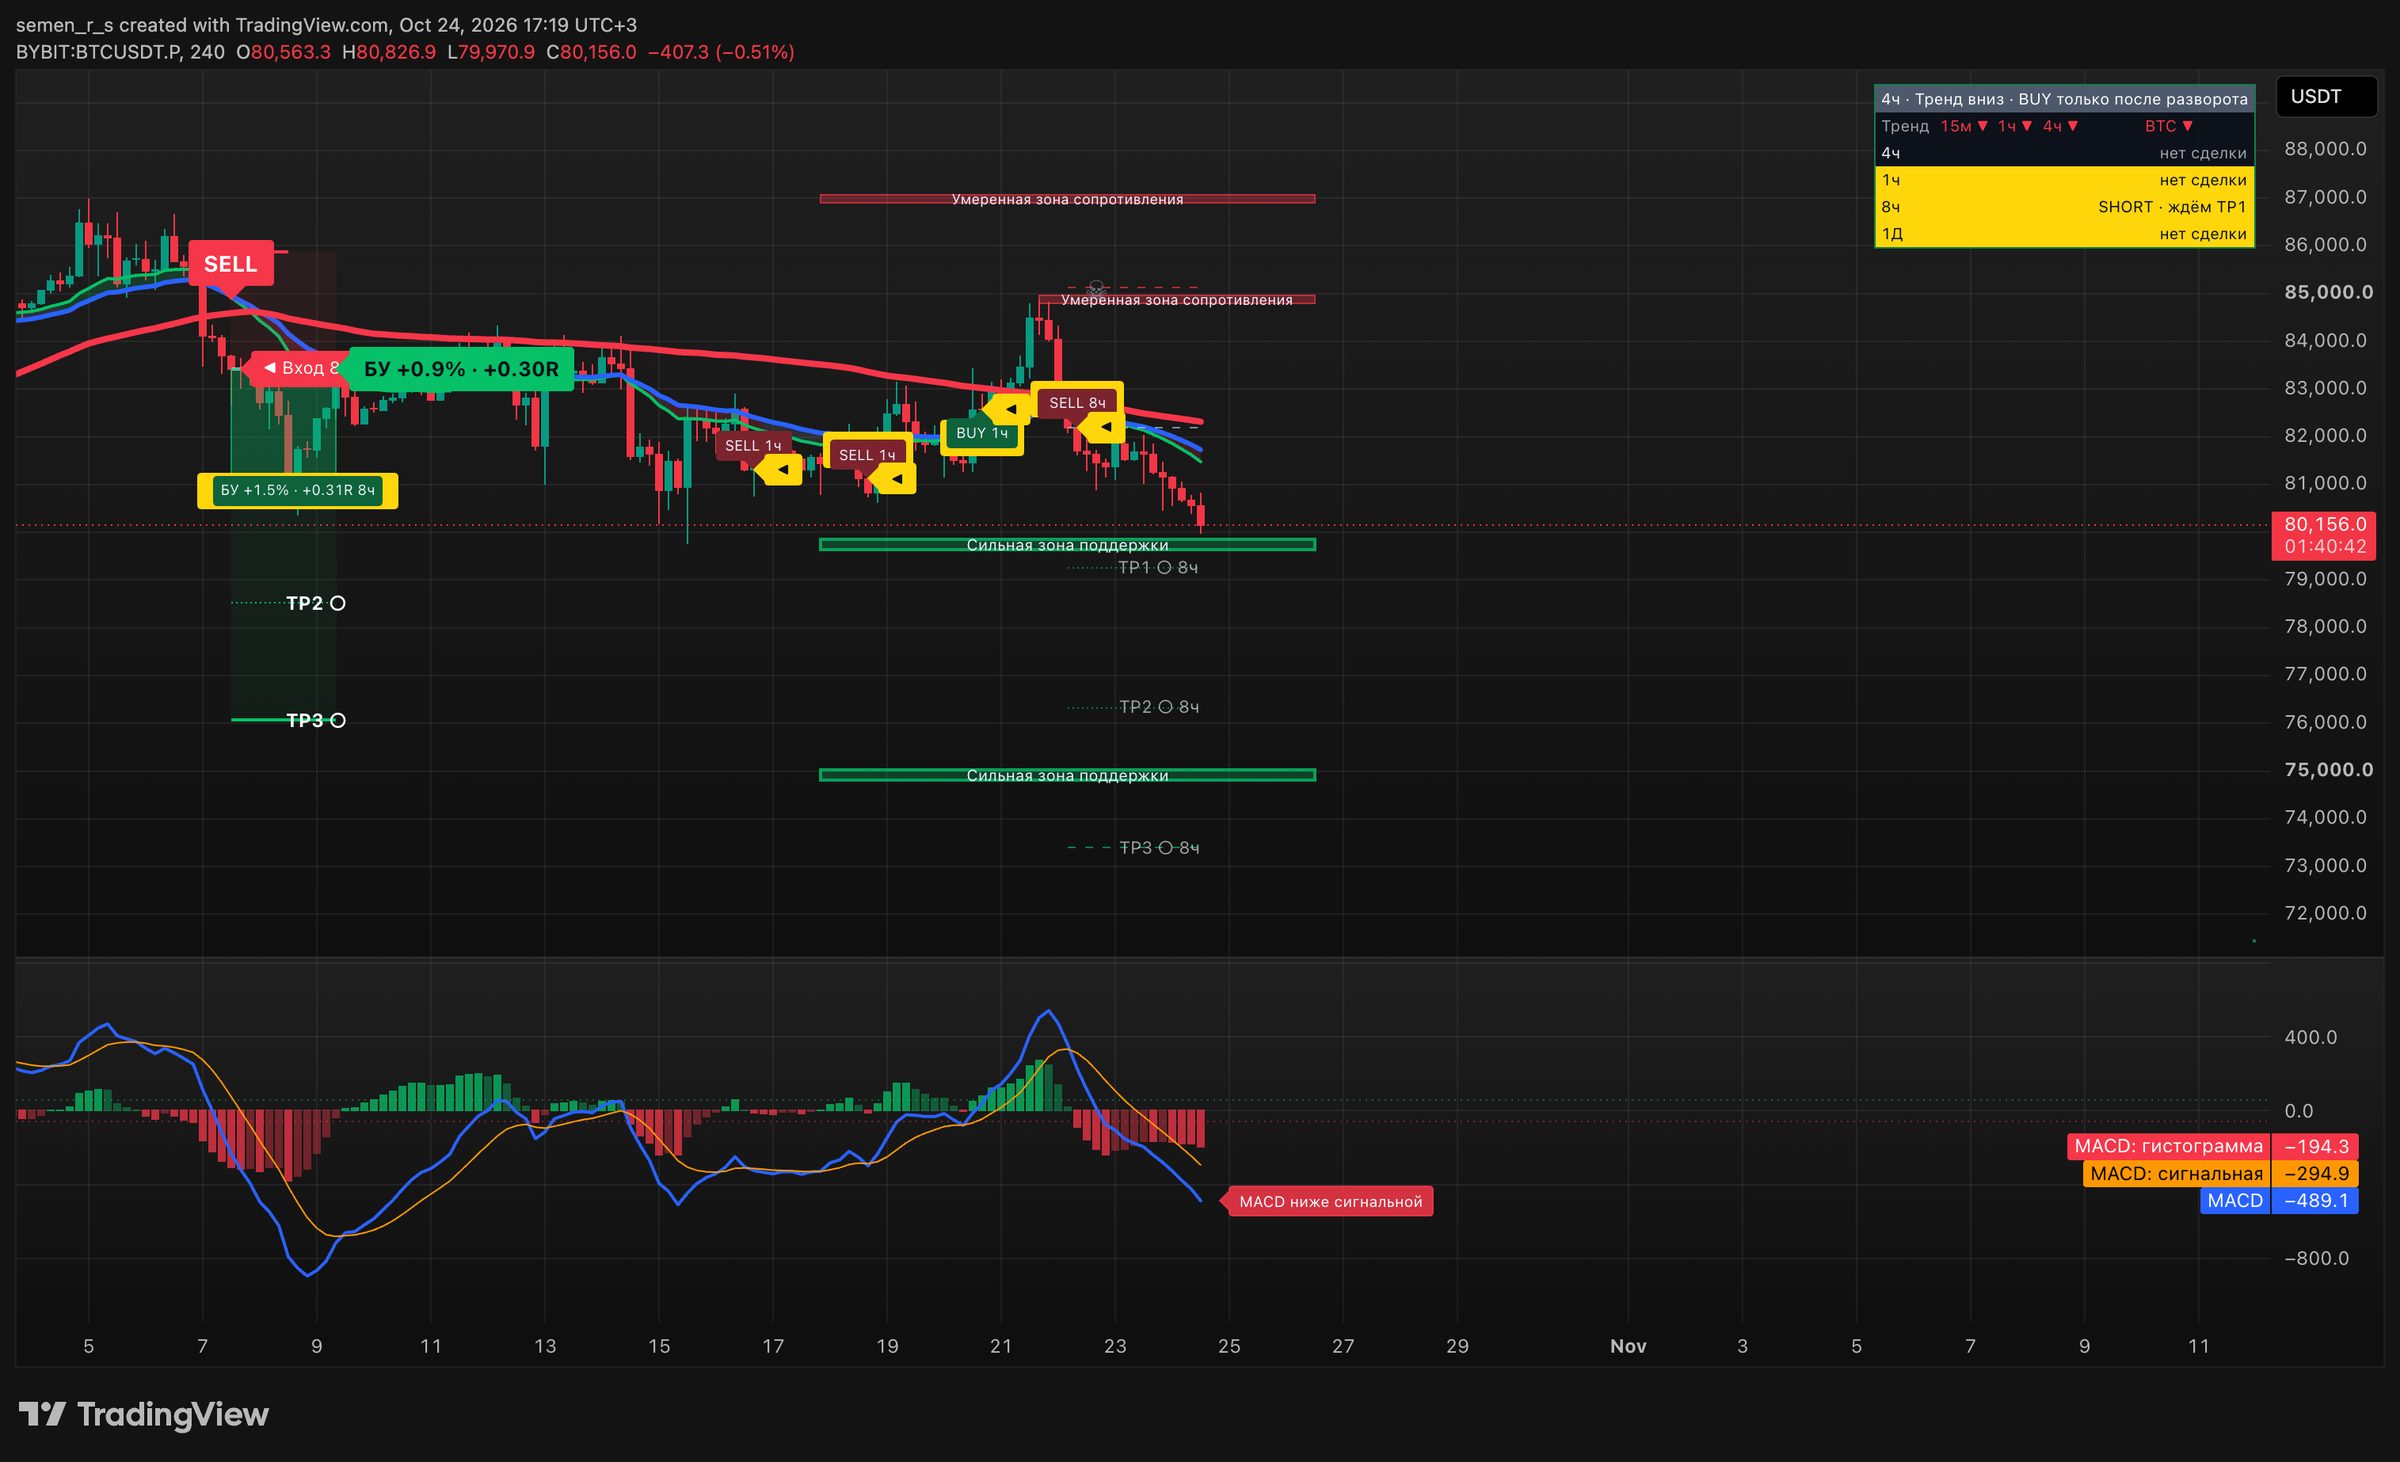
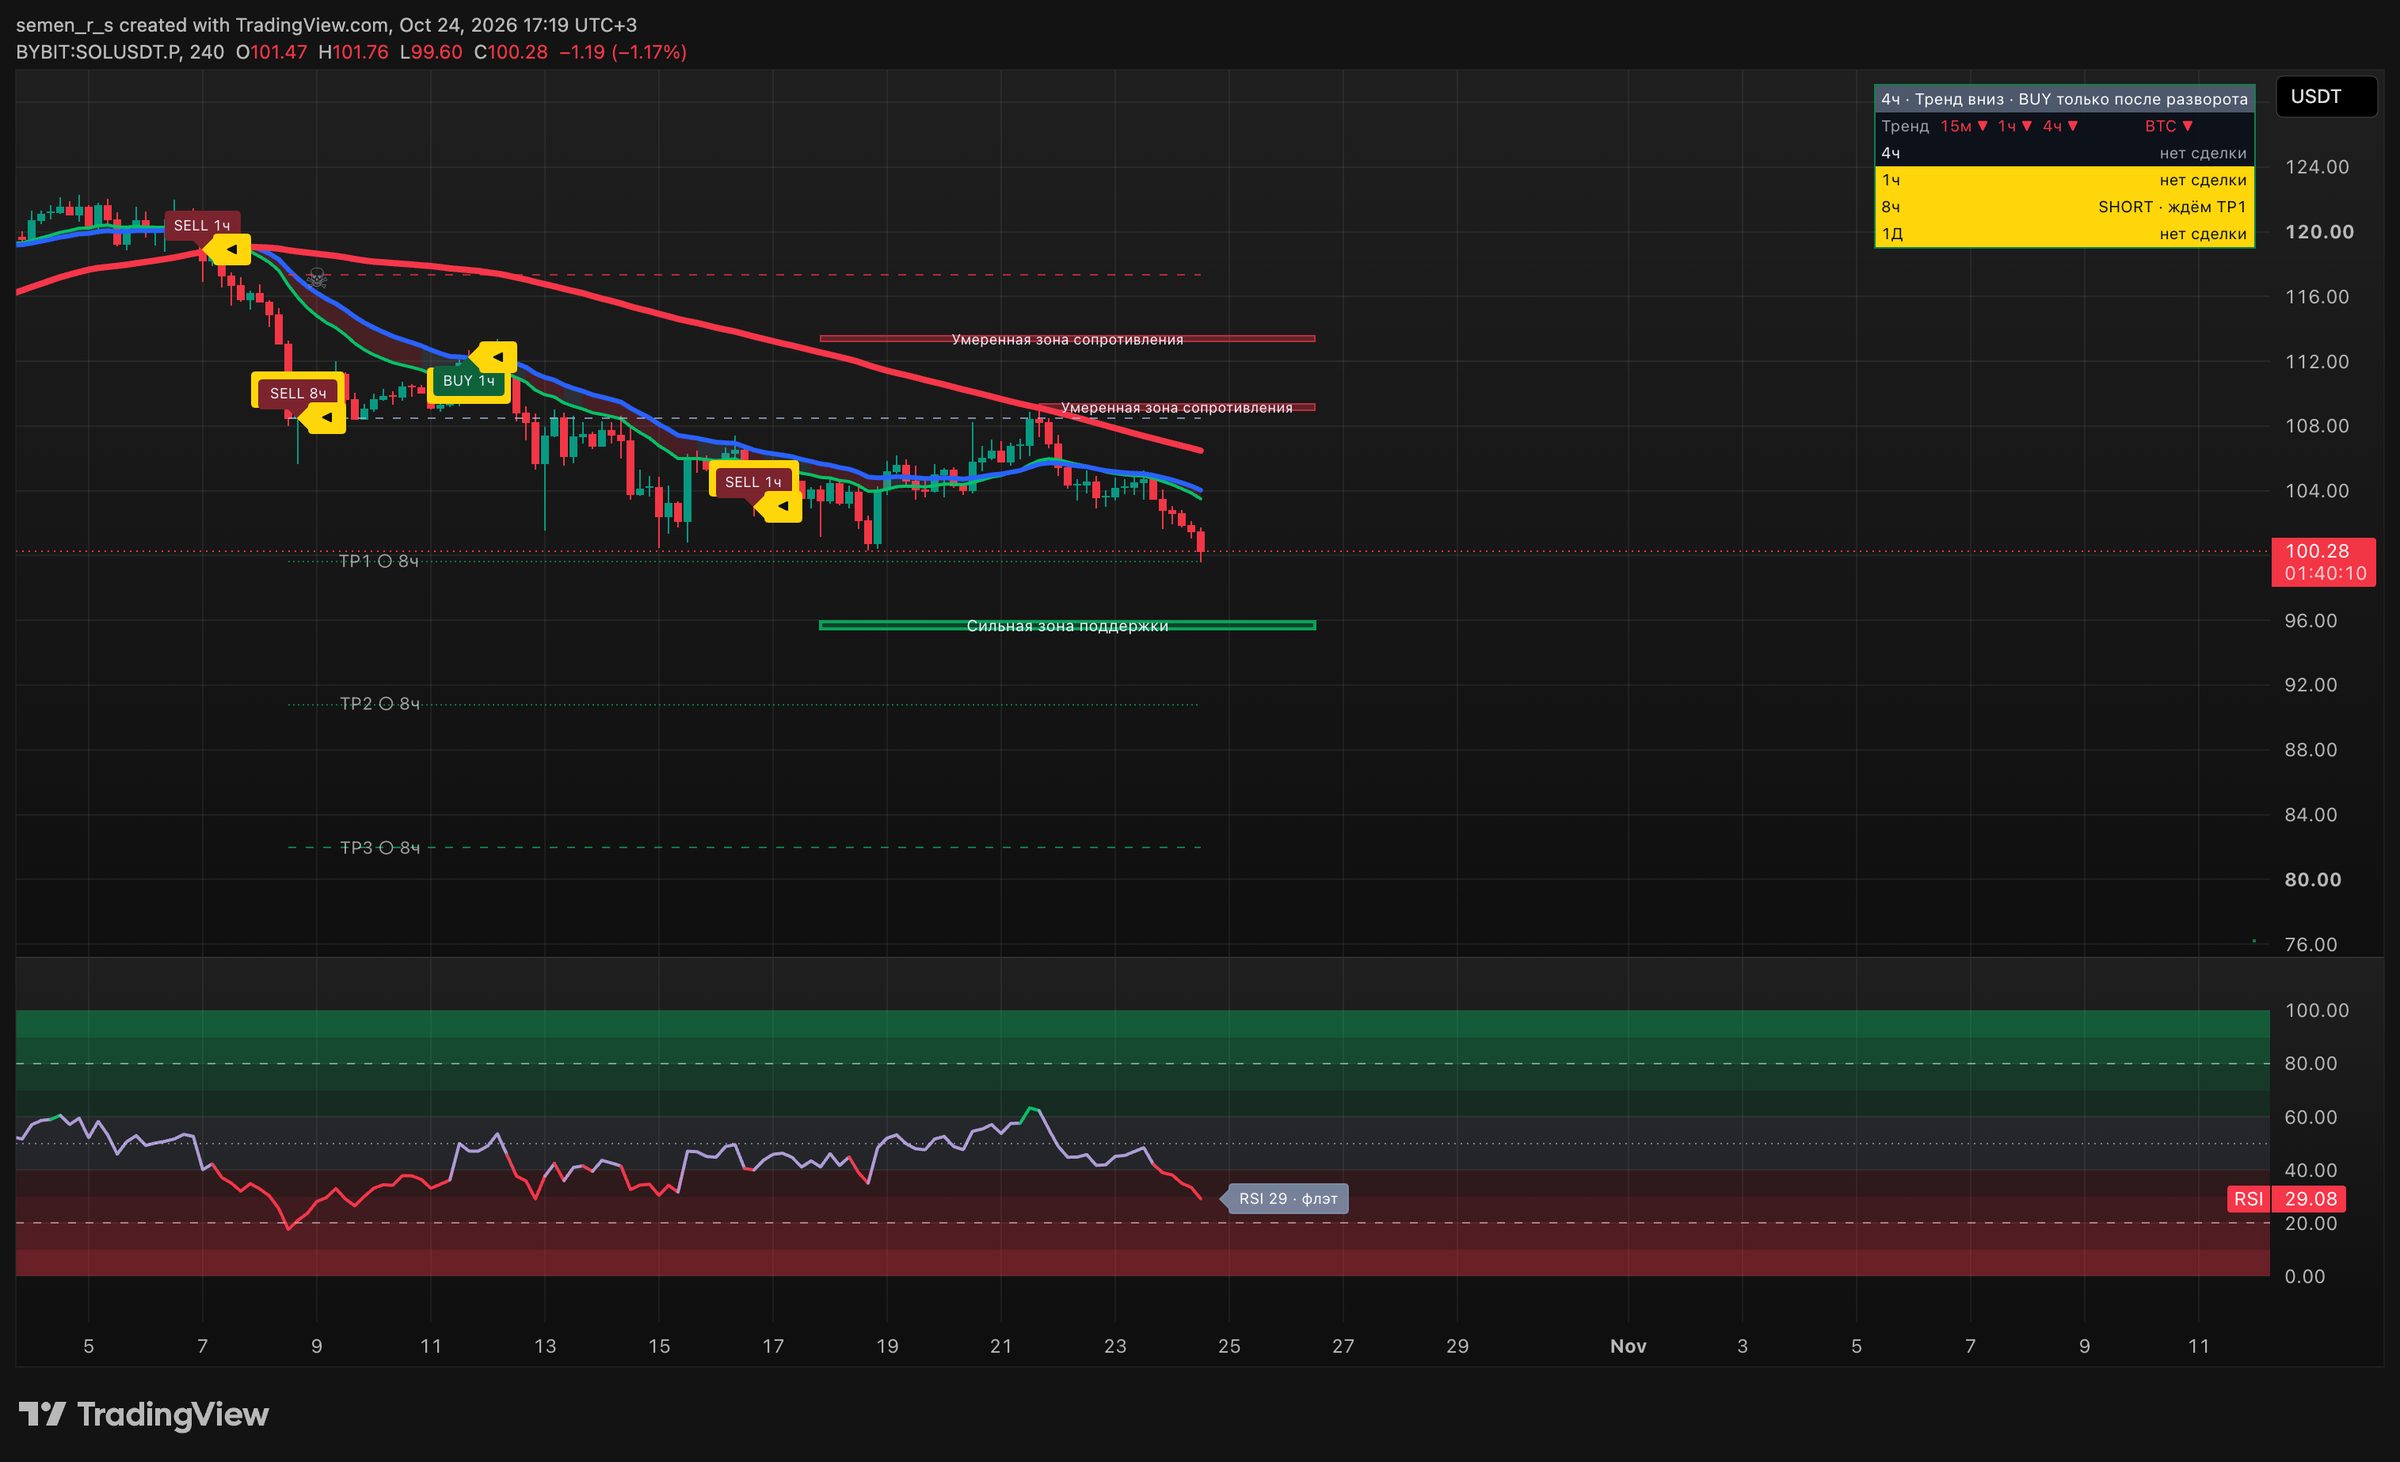
💡 The extra tools only draw on the chart — they don't affect BUY/SELL signals. Turn them off with the same checkbox.
Getting access
How to get the indicator
- Open the bot @CryptoGPTnavigatorAI in Telegram. It replies in Russian for now.
- Choose a plan and pay in the bot. You can start with a 7-day trial.
- Send the bot your TradingView username: access to the script is granted to it within a couple of hours.
- In TradingView: Indicators → Invite-only scripts → CryptoGPT Navigator. Alert setup instructions are in the bot.
Need help getting connected? Contact support through the bot — a real person will reply.
Payment and trial are in the bot. Access is granted to your TradingView username within a couple of hours.
CRYPTOGPT NAVIGATORGet the indicatorAlerts on several coins need a paid TradingView plan: the free plan limits the number of active alerts.
Trade calculator · Bybit-style
Run the numbers before you enter
Enter your capital and leverage — the calculator works out the position, Navigator targets, take profit, stop loss and liquidation.
- Margin (cost)
- Max position
Trade result
- Margin mode
- Isolated margin
- Position value
- Margin
- Quantity
- Entry price
- Liquidation price ≈
Navigator targets: stop , take profit
- TP1
- TP2
- TP3
Navigator plan — close 1/3 of the position at each target:
Example calculation for USDT futures: fees, funding and slippage are not included, and the liquidation price is approximate. This is not a return forecast.
Questions
About the indicator
Can a signal disappear or repaint?
No. A signal is fixed on candle close and never changes. Entry is at the close price, that is, at the open of the next candle.
Do I need to watch the chart?
No. You can trade from alerts: a new trade with its plan, stop moves and the close arrive as a push notification in the TradingView app, a pop-up or an email.
Which coins does it work on?
The tested list is 10 liquid coins: BTC, ETH, SOL, XRP, BNB, DOGE, ADA, AVAX, LTC, NEAR. Other coins are allowed; liquid coins with 1–2 years of history work best.
Is it the same as CryptoGPT copy trading?
No. The indicator is a separate tool for trading yourself, with its own entry rules. It does not open trades, and copy trading results do not apply to it.
Does the indicator guarantee profit?
No. Losing streaks and negative months happen. Judge the result over 50–100 trades, not over a week. Past results do not guarantee future performance.
How do updates arrive?
After an indicator update, remove it from the chart and add it again, otherwise the old version stays. Recreate your alerts as well.